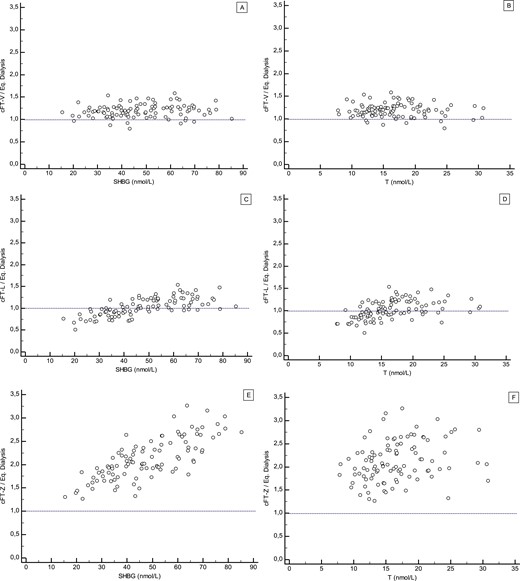
I am 40 years old. I am natural. I recently, I had my total and free testosterone checked, because I suspected it was going to be low. However, it’s actually at the high end of normal. Before anyone asks, no, I haven’t had any other tests related to hormones performed. Is there anything you can tell me about why my testosterone would be so high?
View attachment 54253
Although TT is important to know it means nothing when looking at the bigger picture here.
The critical fraction that truly matters is free testosterone.
Those natty males running around with high/very high TT have high SHBG.
Even though your TT is high your FT is not very high as you are hitting a FT 13.4 ng/dL (Quest ED assay) which is just above where a healthy young natty male would sit tested using the most accurate assay the gold standard Equilibrium Dialysis.
Your FT is healthy not high.
Most ED assays use a reference range 5-21/5-28 ng/dL whereas Quests top-end is 15.5 ng/dL.
When tested using a state of the art standardized ED assay/procedure with a reference range 5-25 ng/dL most natty healthy young males. would be hitting a FT 12 ng/dL.
FT <5 ng/dL would be considerd low.
FT 5-9 ng/dL would be considered the grey zone where some men MAY experience symptoms of low-T.
FT 10-15 ng/dL would be healthy.
FT 20-25 ng/dL would be high-end/high!
*Assays that are standardized are designed to provide accurate results, traceable to “true” value-assigned certified reference materials and gold-standard reference methods. Results obtained using standardized methods can be compared across assays, institutions, populations, and past and future test results, thereby improving diagnosis, treatment, and outcomes of patients
Just to be clear up any confusion this is Fiers camps data for mFT reference ranges not the harmonized reference range being worked on by the CDC.
*Serum samples were analyzed from healthy men participating in the SIBLOS/SIBEX and EMAS studies, both population-based cohort studies
* mFT levels were measured in 867 men using ED LC-MS/MS as previously reported (1). Subsequently, 95% reference ranges were determined using the non-parametric method
Reference: 1. Fiers T, Wu F, Moghetti P, Vanderschueren D, Lapauw B, Kaufman JM. Reassessing Free-Testosterone...
*We established mFT reference ranges for healthy men aged 18 to 69 years
We present 95% mFT age-stratified reference ranges
Age category (years) |
Median mFT (ng/dl) |
95% mFT reference range (ng/dl) |
18-29 (n=140)
30-39 (n=252) |
12.0
9.8 |
6.7-25.3
4.9-18.5 |
40-49 (n=207) |
8.1 |
4.3.14.2 |
50-59 (n=146) |
7.1 |
3.8-12.8 |
60-69 (n=126) |
6.4 |
3.4-11.7 |
70-79 (n=125) |
5.6 |
2.7-8.7 |
*The gold-standard for the determination of FT levels is considered to be directly measured free testosterone (mFT) using equilibrium dialysis followed by mass spectrometry (ED LC-MS/MS). However, no widely accepted reference ranges are available for this clinical parameter. We established mFT reference ranges for healthy men aged 18 to 69 years
*Serum samples were analyzed from healthy men participating in the SIBLOS/SIBEX and EMAS studies, both population-based cohort studies
* mFT levels were measured in 867 men using ED LC-MS/MS as previously reported (1).
Reference: 1. Fiers T, Wu F, Moghetti P, Vanderschueren D, Lapauw B, Kaufman JM. Reassessing Free-Testosterone Calculation by Liquid Chromatography–Tandem Mass Spectrometry Direct Equilibrium Dialysis. J Clin Endocrinol Metab. 2018;103(6). doi:10.1210/jc.2017-02360
Reassessment of FT in women and men with state-of-the-art methodology confirms previously established FT percentages but highlights limitations of differen
academic.oup.com
In the current study, we used a state-of-the-art direct ED method to reassess FT in sets of representative serum samples. This method takes advantage of the ability of a highly sensitive and accurate measurement of T by liquid chromatography–tandem mass spectrometry (LC-MS/MS) to reliably measure the low FT concentration directly in the dialysate after ED. This more straightforward method avoids potential sources of inaccuracy in indirect ED, such as those resulting from tracer impurities or from measures to limit their impact (e.g., sample dilution). We then used the measured FT results to re-evaluate some characteristics of two more established and a more recently proposed calculations for estimation of FT.