TRAVERSE Sexual Function Study

Buy Lab Tests Online

madman

Super Moderator


Within the larger TRAVERSE trial, the Sexual Function Study focuses on the impact of TRT on sexual activity, hypogonadal symptoms, libido, and erectile function in men with low libido.

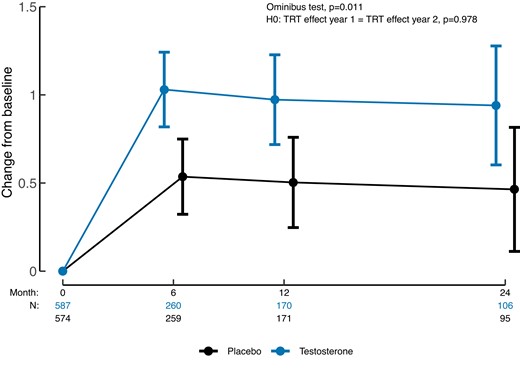
The study involves 5204 men aged 45 to 80 with low testosterone, hypogonadal symptoms, and cardiovascular risk. Among these, 1161 men with low libido were included in the Sexual Function Study, with half receiving 1.62% testosterone gel and the others a placebo gel. The primary outcome measured is the change in sexual activity score, and secondary outcomes include hypogonadal symptoms, erectile function, and sexual desire.

Results show that TRT leads to a significantly greater improvement in sexual activity compared to placebo at 6 and 12 months, with the effect maintained at 24 months. TRT also improves hypogonadal symptoms and sexual desire, but there is no substantial effect on erectile function.

In conclusion, the study demonstrates that TRT over two years improves sexual activity, hypogonadal symptoms, and sexual desire in middle-aged and older men with hypogonadism and low libido, while not significantly affecting erectile function.
 
Defy Medical TRT clinic doctor

madman

Super Moderator
Screenshot (27335).png
 

madman

Super Moderator
Table 1 Baseline Characteristics of Participants in the TRAVERSE Sexual Function Trial and in the Full Analysis Set
Screenshot (27336).png
Screenshot (27337).png


Legend. The data are mean (standard deviation, SD) unless otherwise specified. If the total number of available records was different than total population set, the actual sample size is presented in the brackets. To convert serum total testosterone concentrations in nanograms per deciliter to nanomoles per liter, multiply testosterone concentration in nanograms per deciliter by 0.0347. To convert estradiol concentrations 2 from picogram per milliliter to picomoles per liter, multiply estradiol concentrations in 3 picogram per milliliter by 3.67. To convert dihydrotestosterone concentrations in 4 nanograms per deciliter to nanomoles per liter, multiply dihydrotestosterone 5 concentrations in nanograms per deciliter by 0.0344.
 

madman

Super Moderator
Table 2. Post-randomization Testosterone, DHT and Estradiol
Screenshot (27338).png

Screenshot (27339).png


Legend. Means and standard deviations (SD) are presented for baseline and each visit for subjects with a measurement at the visit. Least Square Means (LS Means) estimates of change from baseline (95% confidence interval (CI)) for each group and the difference between TRT and placebo at each visit are derived from a linear mixed effects model controlling for baseline value and pre-existing CVD, assuming an unstructured covariance matrix. The omnibus test p value (P) is a test of the null hypothesis of no difference between TRT and placebo groups across all time points. To convert serum total testosterone concentrations in nanograms per deciliter to nanomoles per liter, multiply testosterone concentration in nanograms per deciliter by 0.0347. To convert estradiol concentrations from picogram per milliliter to picomoles per liter, multiply estradiol concentrations in picogram per milliliter by 3.67. To convert
dihydrotestosterone concentrations in nanograms per deciliter to nanomoles per liter, multiply dihydrotestosterone concentrations in nanograms per deciliter by 0.0344.

Yr, years; CVD, cardiovascular disease; PDQ-4, question 4 of the Psychosexual Diary Questionnaire; HIS-Q, Hypogonadism Impact of Symptoms Questionnaire; PDE5 Inhibitor, Selective phosphodiesterase 5 inhibitor
 

madman

Super Moderator
Figure 1. Model-estimated changes from baseline in overall sexual activity (PDQ-4 score) in participants enrolled in the Sexual Function Study.
Screenshot (27340).png


Legend: A linear mixed model was fit with fixed effects for treatment, visit, and treatment-visit interaction, baseline PDQ-4 score and pre-existing cardiovascular disease and a random per-subject repeated measures effect with an unstructured covariance matrix. The mean and the corresponding 95% confidence intervals are shown by treatment group and time point. The omnibus test p value from a test of the null hypothesis of no difference between the TRT and placebo groups across all time points is shown
 

madman

Super Moderator
Figure 2. Model-estimated changes from baseline in hypogonadal symptoms (Composite HIS-Q score) (Panel A, top), sexual symptoms (Sexual symptom domain of HIS-Q) (Panel B, middle) and sexual desire (HIS-Q libido subdomain score) (Panel C, bottom) in men enrolled in the Sexual Function Study.
Screenshot (27341).png

Screenshot (27342).png

Screenshot (27343).png

Screenshot (27345).png


Legend: A linear mixed model was fit to each of the three scores, separately, with fixed effects for treatment, visit, and treatment-visit interaction, corresponding baseline score and pre-existing cardiovascular disease and a random per-subject repeated measures effect with an unstructured covariance matrix. The mean and the corresponding 95% confidence intervals are shown by treatment group and time point. The omnibus test p values were derived separately for each score and were derived from a test of the null hypothesis of no difference between the TRT and placebo groups across all time points.
 

madman

Super Moderator
Figure 3. Model-based estimates of Patient Global Impression of Change - Libido score 3 at each visit.
Screenshot (27346).png

Screenshot (27347).png


Legend: A linear mixed model was fit with fixed effects for treatment, visit, and treatment-visit interaction and pre-existing cardiovascular disease and a random per subject repeated measures effect with an unstructured covariance matrix. Lower scores on HIS-Q indicate improvement (fewer symptoms). The mean and the corresponding 95% confidence intervals are shown by treatment group and time point. The omnibus test p value from a test of the null hypothesis of no difference between the TRT and placebo groups across all time points is shown.
 

madman

Super Moderator
Figure 4. Model-estimated change from baseline in erectile function, assessed using 13 IIEF-5, in men enrolled in the Sexual Function Study.
Screenshot (27348).png


Legend: A linear mixed model was fit with fixed effects for treatment, visit, and treatment-visit interaction, baseline value, pre-existing cardiovascular disease and a random per-subject repeated measures effect with an unstructured covariance matrix. The mean and the corresponding 95% confidence intervals are shown by treatment group and time point. The omnibus test p value from a test of the null hypothesis of no difference between the TRT and placebo groups across all time points is shown.
 

madman

Super Moderator
Figure 5. Model-based estimates of change in HIS-Q and its Sexual function and Libido 2 subdomain scores in all TRAVERSE participants (Panels A, B, and C respectively).
Screenshot (27349).png

Screenshot (27350).png

Screenshot (27351).png

Screenshot (27352).png


Legend: A linear mixed model was fit to each of the three scores, separately, with fixed effects for treatment, visit, and treatment-visit interaction, corresponding baseline value and pre-existing cardiovascular disease and a random per-subject repeated measures effect with an unstructured covariance matrix. Lower scores on HIS-Q indicate improvement (fewer symptoms). The mean and the corresponding 95% confidence intervals are shown by treatment group and time point. The omnibus test p values were derived separately for each score and were derived from a test of the null hypothesis of no difference between the TRT and placebo groups across all time points.
 

madman

Super Moderator
Figure 6. Preplanned subgroup analyses of the PDQ-4 by CVD risk (Panels A and B), age group (65 years or older, < 65 years, Panels C and D), baseline testosterone level (< 250 ng/dl; 250 ng/dl or higher; Panel E and F) and race (Black, White; Panels G and H).
Screenshot (27355).png

Screenshot (27359).png

Screenshot (27356).png

Screenshot (27360).png

Screenshot (27357).png

Screenshot (27361).png

Screenshot (27358).png

Screenshot (27362).png


Legend. Four separate linear mixed models were fit with fixed effects for treatment, visit, subpopulation variable (prior CVD risk group, age, testosterone level or race), corresponding two- and three-way interaction terms, baseline PDQ-4 value and a random per-subject repeated measures effect with an unstructured covariance matrix. The models with age, testosterone level or race also included pre-existing cardiovascular disease as a covariate. The LS Means and the corresponding 95% confidence intervals are shown by treatment group and time point for each age group. The omnibus test p value from a test of the null hypothesis of no difference between the TRT and placebo groups across all time points for each age group is shown. The p value for the contrast test of interaction that tested if there is a difference in treatment effect between the two CVD risk groups was 0.421; age groups was 0.338, baseline testosterone levels was 0.089 and race was 0.822.
 
Buy Lab Tests Online
Defy Medical TRT clinic

Sponsors

enclomiphene
nelson vergel coaching for men
Discounted Labs
TRT in UK Balance my hormones
Testosterone books nelson vergel
Register on ExcelMale.com
Trimix HCG Offer Excelmale
Thumos USA men's mentoring and coaching
Testosterone TRT HRT Doctor Near Me

Online statistics

Members online
8
Guests online
7
Total visitors
15

Latest posts

bodybuilder test discounted labs
Top