Would not even waste my time getting caught up on this as all that matters now is where your current trough FT level sits which is absurdly high!
Something to keep in mind here is even though you lowered your dose slightly you changed your injection frequency from 2X/week to 3X/week which will clip the peak--->trough.
You will soften the peak and bring up the trough.
Top it off that your SHBG was driven down from 33-25 nmol/L.
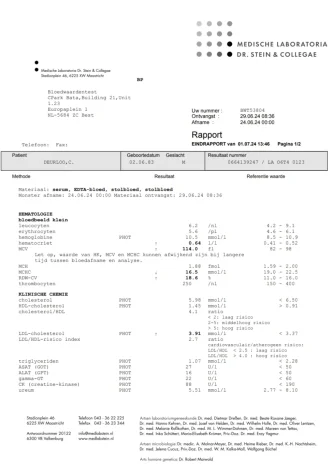
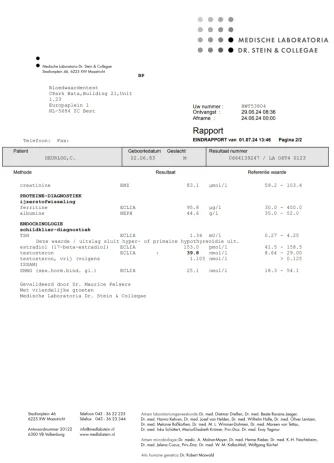
If we calculate your FT using the linear law-of-mass action cFTV with a very high trough TT 1148 ng/dL, lowish SHBG 25.1 nmol/L and Albumin 4.4 g/dL your trough FT 32.2 ng/dL is absurdly high!
View attachment 45990
You are injecting 125 mg T split 3x/week and as you can see you are still hitting a very high trough TT 1148 ng/dL and more importantly your trough FT is still very high as in 32.2 ng/dL!
You drove your trough FT from 27.8---> a whopping 32.2 ng/dL on your new protocol which also means that your peak will be even higher!
This is not going to do you any favors when it comes to lowering your H/H and even then you most likely had a high-end/
high hematocrit pre-trt and unfortunately you have no idea where it truly sat pre-trt as you never had these critical blood markers tested before hopping on exogenous testosterone.
Big mistake here.
Again although other factors such as dehydration, sleep apnea, smoking, asthma, COPD can cause elevated hematocrit this is a common side-effect when using exogenous testosterone especially from running too high a trough FT level.
Your trough cFTV is a whopping 32.2 ng/dL.
My reply from a previous thread regarding FT levels.
Just to be clear here the only way to know where your FT level truly sits is to have it tested using what would be considered the most accurate assay the gold standard Equilibrium Dialysis especially in cases of altered SHBG!
If you do not have access to such (highly doubtful) if you live in the US then you would need to use/rely upon the linear law-of-mass action cFTV.
Keep in mind as of now cFTV tends to slightly overestimate when compared against a standardized ED assay.
Just to put this in perspective most healthy young males would be hitting a FT 10 ng/dL tested using the gold standard Equilibrium Dialysis assay (most accurate) or a cFTV 13-15 ng/dL and this is a short-lived peak to boot!
Trough would be 20-25% lower.
More importantly a FT in the low 20s whether cFTV or standardized ED assay would be very high!
Everyone needs to hammerit in their heads that a trough FT 30 ng/dL is absurdly high.
We are talking f**king TROUGH here not peak!
Again you EASILY have room to lower your weekly dose and bring down your TROUGH FT!
Plain and simple!
Just to be clear up any confusion this is Fiers camps data for mFT reference ranges not the harmonized reference range being worked on by the CDC. *Serum samples were analyzed from healthy men participating in the SIBLOS/SIBEX and EMAS studies, both population-based cohort studies * mFT...

www.excelmale.com
*We established mFT reference ranges for healthy men aged 18 to 69 years
We present 95% mFT age-stratified reference ranges
Age category (years)
|
Median mFT (ng/dl)
|
95% mFT reference range (ng/dl)
|
25-29 (n=148)
|
10.3
|
5.6 - 17.1
|
30-39 (n=252)
|
9.7
|
4.9 - 18.1
|
40-49 (n=207)
|
8.0
|
4.3 - 13.5
|
50-59 (n=146)
|
7.0
|
3.8 - 12.6
|
60-69 (n=114)
|
5.9
|
3.3 - 11.9
|
*The gold-standard for the determination of FT levels is considered to be directly measured free testosterone (mFT) using equilibrium dialysis followed by mass spectrometry (ED LC-MS/MS). However, no widely accepted reference ranges are available for this clinical parameter. We established mFT reference ranges for healthy men aged 18 to 69 years
*Serum samples were analyzed from healthy men participating in the SIBLOS/SIBEX and EMAS studies, both population-based cohort studies
* mFT levels were measured in 867 men using ED LC-MS/MS as previously reported (1).
Reference: 1. Fiers T, Wu F, Moghetti P, Vanderschueren D, Lapauw B, Kaufman JM. Reassessing Free-Testosterone Calculation by Liquid Chromatography–Tandem Mass Spectrometry Direct Equilibrium Dialysis. J Clin Endocrinol Metab. 2018;103(6). doi:10.1210/jc.2017-02360
In the current study, we used a state-of-the-art direct ED method to reassess FT in sets of representative serum samples. This method takes advantage of the ability of a highly sensitive and accurate measurement of T by liquid chromatography–tandem mass spectrometry (LC-MS/MS) to reliably measure the low FT concentration directly in the dialysate after ED. This more straightforward method avoids potential sources of inaccuracy in indirect ED, such as those resulting from tracer impurities or from measures to limit their impact (e.g., sample dilution). We then used the measured FT results to re-evaluate some characteristics of two more established and a more recently proposed calculations for estimation of FT.